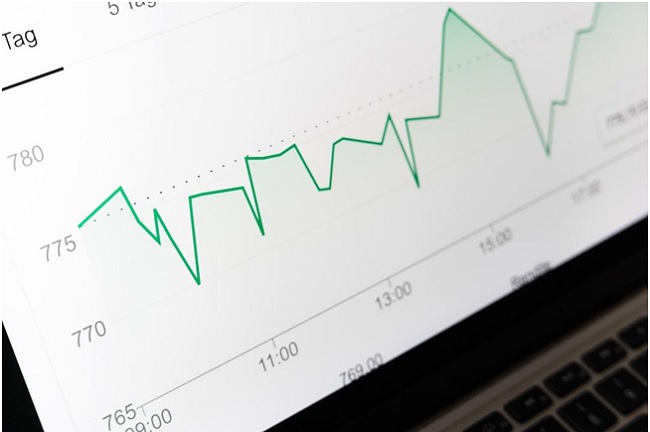
Data analysis has become a crucial aspect of running a successful business in today’s fast-paced and data-driven world. Businesses need to constantly measure and track their performance to make informed decisions.
A significant part of this measurement is the visual representation of data, and one of the most practical and widely used Tools for this purpose is the line graph. A line graph or line chart is known for its simplicity and effectiveness.
By plotting data points on a line graph, businesses can see how certain factors impact their performance and make strategic decisions accordingly. Keep reading to explore where a line chart can be most beneficial to your Business.
Understanding the Context of Line Charts

Understanding how a line chart works and the context in which it’s most useful is vital. A line chart represents a full series of data points connected by a line. Given its structure, it’s most effective for visualizing data that displays continuous change over a period of time, rendering the line graph as an uncrowned king of trend analysis.
Read Also:
Businesses find it beneficial due to the ability to plot multiple datasets on one chart, offering comparative insights. From this comparative analysis, businesses can identify correlations, trends, and inconsistencies in their data effectively.
These abilities can result in a better understanding of the business environment and a clear view of opportunities and will eventually contribute to making informed, data-driven decisions.
Using Line Charts for Marketing Data
Line charts have indispensable value in the marketing realm. Marketers are constantly dealing with vast amounts of data, from Website traffic and conversion rates to the success of different marketing campaigns.
By leveraging line charts, one can easily track the effectiveness of various marketing strategies over time, compare the performance of various channels, or spot potential opportunities for growth.
For instance, in email marketing, a line chart can effectively visualize open rates or click-through rates over time, assisting in the determination of campaign performance.
Additionally, using line charts to monitor website traffic can assist in spotting trends and making informed decisions about content strategy. For instance, a spike in visits after publishing a particular type of content might indicate this content would attract more visitors in the future.
Line Charts for Financial Analysis

Financial professionals often turn to line charts to evaluate company performance over time or against a benchmark. Whether it’s revenue growth, net profit margins, stock prices, or cash flow, line charts offer a lucid method to measure and monitor financial evolution.
One of the most popular uses for line charts in this context is to track an organization’s stock prices over time. With the fluctuation of prices clearly displayed on a chart, investors can make informed decisions about Buying and selling stock.
Similarly, companies can use these charts to track their own performance and make strategic decisions. Moreover, financial statements that include line charts can provide stakeholders with valuable insight into how the company is performing financially.
By contrasting this information with other pertinent details about the company’s performance, like operational or customer data, stakeholders can gain a nuanced understanding of the company’s overall health and prospects.
Read Also:
- Video Editing Software
- PC Optimization Software
- Network Monitoring Software
- Project Management Software
Future Predictions and Trend Analysis With Line Charts
Companies operate in dynamic environments, constantly evolving with changing industry trends, customer behavior, and emerging Technologies. Therefore, they need tools that can help them understand the current dynamics and make predictions about the future.
With the help of line charts, companies can analyze past trends and predict future ones. For instance, by analyzing past sales data using a line chart, a company can predict what future sales might look like under similar conditions. This form of predictive analysis can help in planning inventory, budgeting, and other strategic decisions.
Line charts can also be used to forecast market trends, enabling businesses to adapt their strategies and stay ahead of the competition. In fact, line charts are frequently used in forecasting economic trends, such as inflation rates or GDP growth.
Overall, the use of a line chart is a testament to the ever-increasing importance of data analysis in business. By turning raw figures into actionable insights, businesses can move away from intuition-based decision-making to a more precise, data-driven approach, leading to better performance and a competitive edge.


